we can use the same variables for the cosine function y=a cos [b(x + c)]+d
Below are the graphs of y=sinx and y=2sinx

as you can see, the a variable from above designates the amplitude of the graph
these are the graphs of y=sinx and y=sin2x
in this example, you can see than increasing the b variable shortens the period of the graph.
changing the c variable shifts the graph on the x axis a value of -c

this is called phase shift
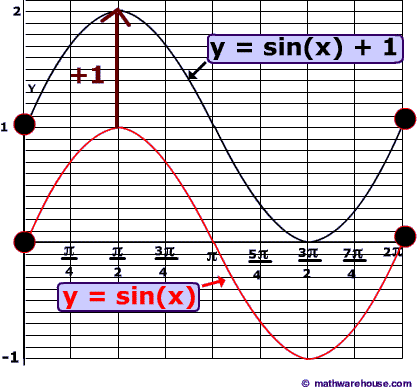
changing the d variable vertically shifts the graph a distance equal to d

this is called mid-line shift
the graph for cosine behaves very similarly to the sin graph, however the cosine graph reaches its amplitude (1) when x=0. other than this shift, the two graphs are identical. the cosine function is even, while the sine function is odd.

No comments:
Post a Comment